SSI MBBR Problem Solver – Dairy Dangers
By: Doreen Tresca
Post Date: agosto 5th 2020
Dairy wastewaters are notoriously difficult to treat. At a close look, the truth is really in the chemistry. Every dairy application is different. No two plants use the exact same combination of formula, equipment, inlet water quality, etc. As water and wastewater professionals, we should always strive to understand and treat the conditions of one plant independently of another.
When we take time to consider the entire supply chain, from feed stock to type of animal, you will find that the outcome can be highly variable from one plant to the next. A farmer may change feed or food source during spring to summer, or climate conditions impact the animal’s caloric intake. Many studies have shown the level of urea in milk is highly variable based on protein intake. Ultimately, it all ends up in the wastewater treatment plant. This principle not only applies to dairy, but also to a number of industries (textile, food and beverage, leachate, etc).
My team and I are frequently asked to consult on plants with decreasing efficiency, diagnose ongoing operational challenges, evaluate performance enhancements, etc. Recently we were contacted by a yogurt manufacturer to diagnose declining WWTP efficiency. We evaluated several existing processes at the plant including mechanical and biological systems, but also the specific chemistry of the wastewater. Upon close examination, a significant amount of organic nitrogen, cellulose and calcium salts were found. Raw influent COD values often exceeded 10,000 ppm, with average COD values between 4,000 and 5,000 ppm. Total nitrogen values often exceed 150 ppm. While the raw influent ammonia values were often below 2 ppm, we found the Ammonia-Nitrogen in the plant increasing from process to process. Our assessment was that a combination of chemical precipitation and unaccounted organic nitrogen breakdown had led to declining treatment efficiency. The existing biological system had failed to take in account high levels of calcium salts, cellulose and the propensity of these chemicals to precipitate in solution.
Due to the clients limited time for process disruption, as well as concerns over infrastructure modifications, we felt that a properly designed MBBR system would help the end user increase efficiency with shortest downtime and best return on investment. For anyone who has designed, owned or operated an MBBR, it is no secret they can be a powerful treatment method.
MBBR systems are typically designed using a surface area loading and surface removal relationship (i.e. Grams of substance per protected surface area of biofilm carrier). In general, SALRs follow a semi natural log approach with temperature being a primary variable. In other words, the higher the temperature, the higher the SALR can be achieved while maintaining 90% SARR relationship. Most of our designs are based on 90% removal efficiency. Note, there is no “one” curve or graph for MBBR systems. Every wastewater source has its own unique design approach due to a combination of factors. In many areas, I’ve witnessed designers simply using published values without understanding water chemistry and the resulting interaction of biofilm carriers. Some are lucky, while others fail miserably. The design and application of MBBR should always take into consideration the following:
- Inorganic substances: unless sufficiently screened or precipitated, inorganic compounds can accumulate on biofilm carrier surfaces, reducing the available area for biological growth, further reducing the available diffusion-able area. These compounds may also impact aeration design and system efficiency. SALR design and aeration design should take this into consideration.
- Conductivity: this can be a precursor to understanding aeration behavior as well as the system’s ability to precipitate in solution. Excess dissolved salts or carbonates can impact aeration and biofilm carrier selection.
- pH and temperature impact on precipitation: some compounds react well and dissolve with higher pH and temperatures, while others actually precipitate in solution. Lime (CaOH), by example, is often used for pH control. One (1) unit change in pH is an order of magnitude more Lime by addition. While operating between 7-8 pH is common practice, note that 8 pH is an order magnitude more Lime.
- Aeration integration: this is perhaps one of the most overlooked items for MBBR design. Proper aeration devices and aeration integration are integral to a well performing MBBR. You simply can’t add biofilm carriers to an existing system and expect great things to happen. We always design aeration and biofilm carrier integration together to ensure we have the most optimized MBBR system. With the advent of fine bubble PTFE based aeration technology, MBBR systems are capable of ultra-high volumetric efficiency with minimum maintenance. For those you think only coarse bubble aeration can be applied, think again. With the proper fine bubble aeration device, proper integration and forethought, Fine Bubble MBBR operation can provide the highest volumetric efficiency MBBR and long, maintenance free life. More here https://www.ssiaeration.com/mbbr-systems-ssi/; https://www.ssiaeration.com//wp-content/uploads/2016/01/SSI-Brochure.pdf
- Diffusion characteristics: Whether the system is BOD reduction only, Nitrogen reduction or a combination of the two, there are differences in biofilm carrier design. Some carriers work well in one environment, and poorly in others. This is because of the type and available area for diffusion matters.
- Surface area vs loading rate: effective surface area for biofilm carrier design isn’t everything, but in general it helps to have moderate to high surface areas for best reactor design. Higher SA carriers may have a limited organic loading range and aren’t always the best delivered value for a project. You see this often with chip, foam and gas-injected carriers. While the carrier depth may be thin, it does not necessarily mean optimal diffusion in all environments. Lower SA carriers can have higher organic loading values and can be a safer design but may require more media and less room for future expansion.
- Mixing: proper mixing of biofilm carriers is crucial. Afterall, the process relies on the carriers being uniformly distributed and complete mix conditions to ensure contact time with substrate. The best available biofilm carriers have been optimized with mixing and energy consumption in mind. The shape and density of the carrier play important roles in what type of aeration to use and what energy input is required. In today’s marketplace, you may be shocked to see that the difference between brand “x” and brand “y” may be a 3x difference in energy required to mix!
- Proper MBBR integration should account for all hydrodynamic properties including diffusion, bubble coalescence, fouling rates or loss of effective surface after acclimation, biofilm thickness, mixing energy, etc.
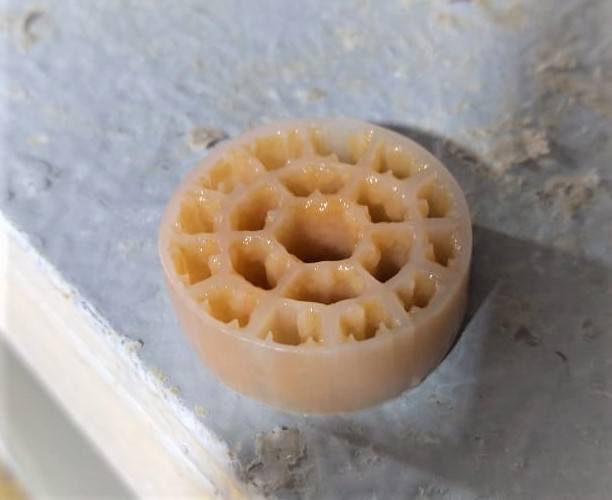
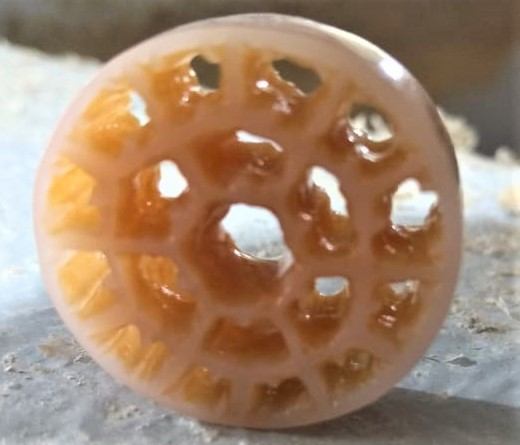
We ultimately provided design and supply of an enhanced MBBR process, utilizing full floor cover diffused aeration and virgin HDPE biofilm carriers with 589 m2/m3 of effective surface area. Higher SA carriers were considered, but due to the inorganics present and high COD loading, a lower SA carrier was chosen to ensure sufficient diffusion-able area was available for best long term operation. Considerable time was given to the best aeration design, with both Fine Bubble and Coarse Bubble options discussed. While the fine bubble provided the best energy balance, stainless wide band coarse bubble aeration was chosen to reduce maintenance. The MBBR was chosen due to its operational simplicity, ease of upgrade and high rate of treatment. Upon commissioning, the plant was immediately able to achieve higher degree of organic reduction while simultaneously reducing the power draw of the existing blower system. Despite using coarse aeration, the increase mass transfer (alpha value) and oxygen transfer allowed the plant to reuse the existing blower network. The increased biological efficiency ultimately allowed the end user to easily process another 20% flow rate within the existing infrastructure while maintaining the same effluent COD values. The MBBR supplied operates as a 2-stage system, with each stage operating at ~33% by volume.

Mrs. Tresca is in charge of SSI’s Marketing Department. In addition, she is involved in sales and and believes in putting “customers first.” Mrs. Tresca is a graduate of the University of Buffalo.


